
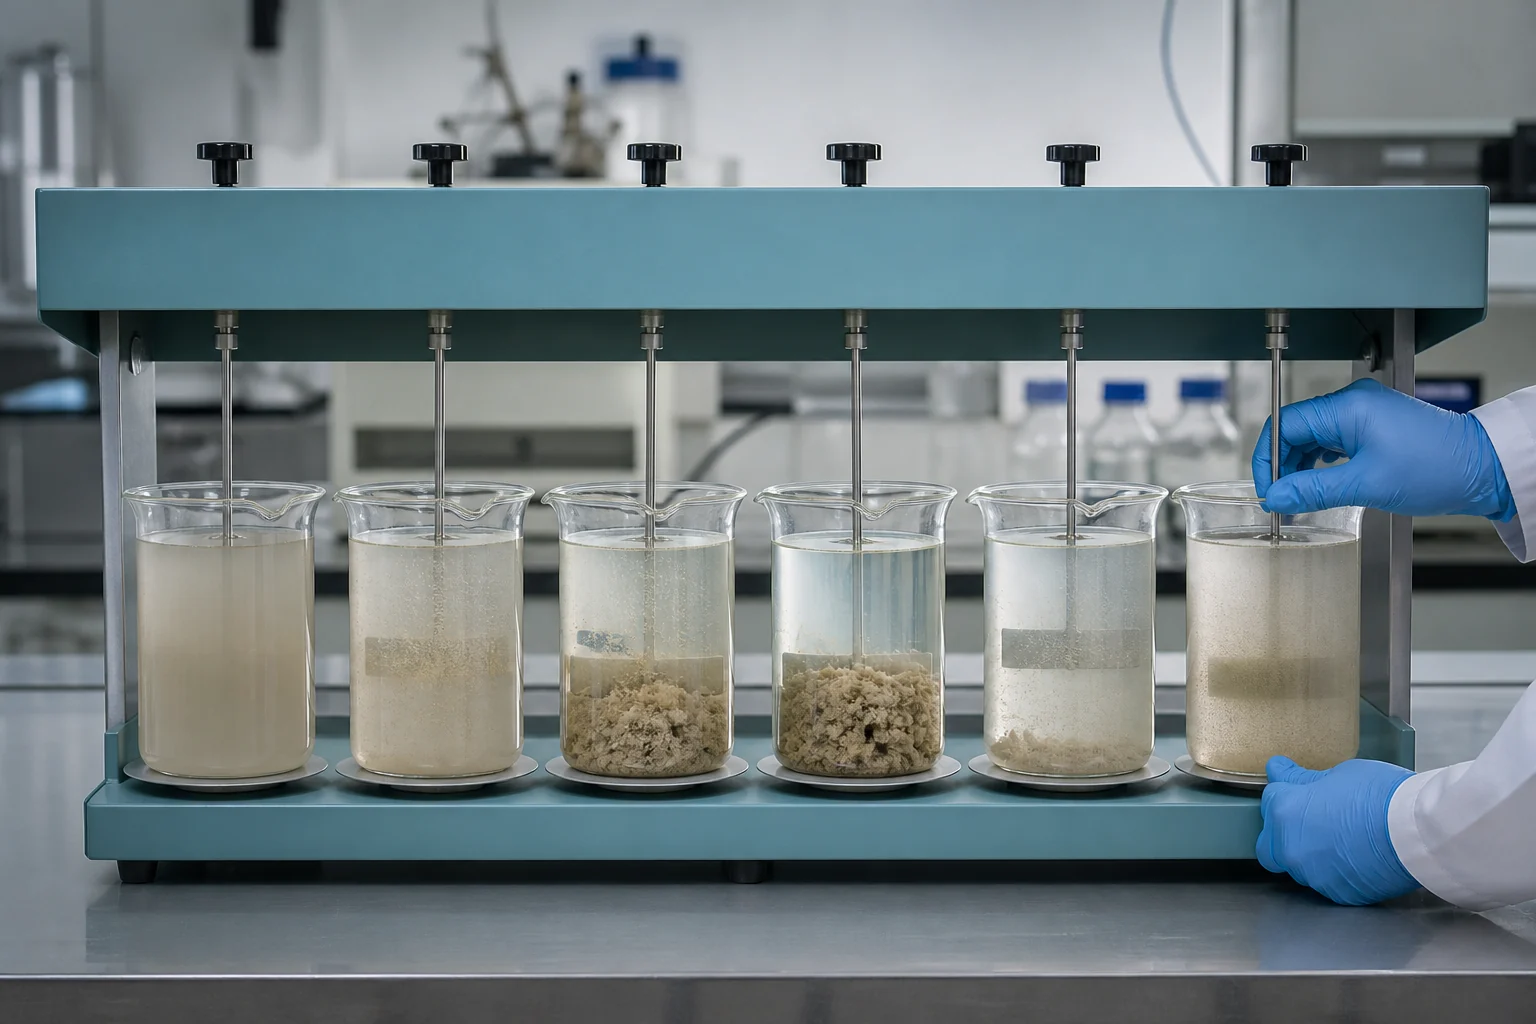
Polyacrylamide flocculant dosage should be expressed on an active-polymer basis and tied to the material being treated. A pump speed or litres per hour is not a transferable dosage because stock-solution concentration, water flow and solids loading can all change.
Dosage for water clarification
For a water stream, active dose in milligrams per litre can be calculated from active polymer mass and treated-water volume. If a prepared solution is used, first calculate the active polymer contained in that solution. Record both the make-down concentration and the final active dose.
Active dose (mg/L) = active polymer feed (g/h) × 1,000 ÷ water flow (m³/h).
Dosage for sludge dewatering
Dewatering dose is commonly compared as kilograms of active polymer per tonne of dry solids. Determine wet sludge flow and dry-solids percentage, then calculate dry-solids throughput. This prevents a plant from appearing to need more polymer simply because sludge concentration fell.
Dry solids (t/h) = sludge flow (m³/h) × density (t/m³) × dry-solids fraction. Divide active polymer kilograms per hour by dry solids tonnes per hour to obtain kg/t DS.
Build a dose-response curve
Test a blank and several doses below and above the expected operating point. For clarification, record settling, turbidity and sludge volume. For dewatering, record capture, cake solids, centrate or filtrate quality and throughput. The best operating dose is often the lowest point that reliably meets all important targets, not the dose that creates the largest floc.
Recognize underdose and overdose
Underdose leaves fine particles dispersed, creates weak floc and reduces capture. Overdose can re-stabilize particles, produce sticky sludge, cloudy water or poor compaction. Both failures can look like a wrong product, so concentration and pump calibration must be checked before changing grades.
Optimize total treatment cost
Compare polymer cost against throughput, water recovery, sludge hauling, cake dryness and downstream stability. A more expensive product can cost less per tonne treated if its active dose is lower or its operating window is broader. Conversely, an apparently low bag price may hide poor dissolution or high consumption.
The solution preparation guide removes a major source of dosing error, while the PAM buying guide lists the data required for quotations. Send flow, solids, stock concentration, current dose and target result to the polyacrylamide manufacturer. Application-specific product ranges are also summarized by this polyacrylamide supplier resource.
Example of normalizing a changing sludge feed
If wet sludge flow remains constant but dry solids fall from 3% to 2%, the same polymer kilograms per hour represent a 50% higher dose per tonne of dry solids. Without normalization, operators may wrongly conclude that the product suddenly improved. Calculate dry-solids loading for every comparison and verify density when the stream is unusual.
Use rolling averages for variable processes and retain the raw flow, concentration and laboratory measurements. A dosing KPI is meaningful only when its units, active content and sampling period are consistent.
Verify every value used in the calculation
Powder feeder output, liquid-polymer active content, dilution-water flow and sludge-solids tests all introduce error. Calibrate each device independently and repeat the dry-solids test during a trial. If a stock solution is described as 0.1%, confirm whether the value is weight per weight or weight per volume and whether product active content has been considered.
Report a range rather than one universal dosage. Feed chemistry and solids vary, and a robust product should meet targets across a practical window. For quotations, state average and peak flow, solids loading, operating hours and monthly demand so packaging and delivered cost can be calculated consistently.
Minimum data for a reliable dosage report
Keep raw flow, solids concentration, solution concentration, product active content, pump calibration, operating hours and measured treatment results. State whether dosage is mg/L, g/m³ or kg/t dry solids. Convert competing products to the same active basis before calculating cost. This prevents concentration changes and unit errors from being presented as chemical savings.